
INFOGRAPHICS: Charts that explain CBN’s 2024 financial position
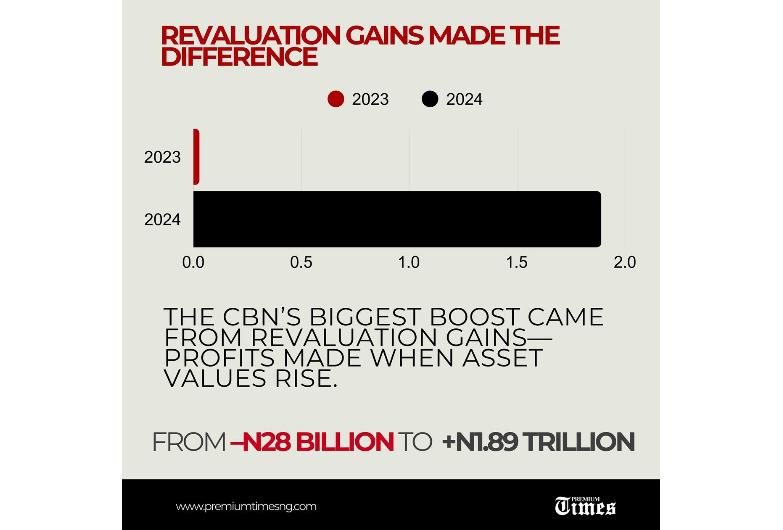
[[{“value”:”The turnaround was largely driven by a sharp rise in revaluation gains and profits made when the value of assets such as foreign reserves increased, alongside a tripling of “other income” to N12.9 trillion.
The post INFOGRAPHICS: Charts that explain CBN’s 2024 financial position appeared first on Premium Times Nigeria.”}]]